With ToleranceCalc, performing 1D/2D tolerance and producibility analysis of parts and assemblies in any CAD application is as easy as one, two, and three.
1. Sketch the tolerance vector chain in CAD starting from datum to point-of-interest using model or drawing geometry as overlay. Save the vector chain in DXF file format.
2. Start ToleranceCalc wizard and load the vector chain saved in step 1. Enter the tolerances for contributors and specify statistical analysis parameters in the Setup pane. Click a button.
3. In a split-second results are shown in the results pane. Sensitivity pane shows percentage-sorted list of contributors.
Following is step-by-step illustration of how ToleranceCalc works to analyze tolerance Stackup in an assembly. Here the user is interested in analyzing the effect of tolerances stacking up on the pin’s Y co-ordinate in top right in an assembly as shown below.
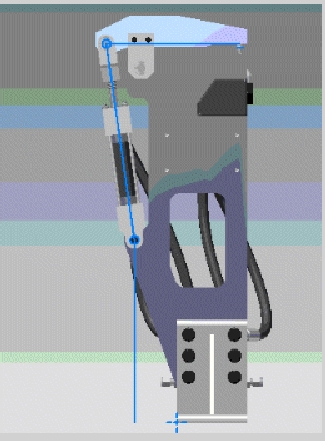
Step 1. Extract tolerance vector chain from CAD: User starts by identifying and sketching tolerance vector chains using the CAD sketcher with model geometry as overlay. By snapping to features, this a simple “connecting the dots” process - in the picture above the blue lines represent the vector chain of tolerance contributors starting from datum at bottom left ending at the point-of interest, the end of the pin on the right top.
Step 2. Setup ToleranceCalc: User launches the ToleranceCalc wizard and loads the DXF file containing the vector chain saved in step 1. The vector chain appears in ToleranceCalc graphic window in the setup pane as shown below.
Note: The nominal values are read directly from CAD geometry so manual-entry errors are eliminated. ToleranceCalc automatically assumes the same unit system as the CAD application.
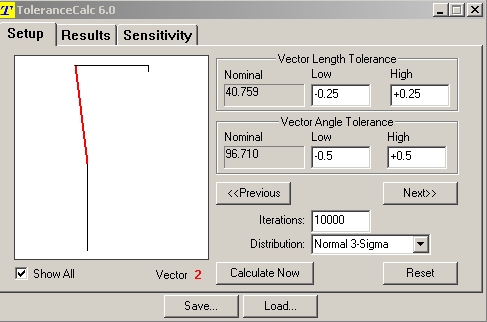
Using the Previous and Next buttons user propagates through each contributor and enters Vector length as well as angle (kinematic) tolerance as applicable for each contributor.
The tolerances entered may be gd&t values, machining tolerances from process capabilities, tolerances that reflect past experiences, fixed tolerances of parts that are outsourced, tolerances that are coming from design calculations, and tolerances you enter as starting point for performing "what if" analysis.
Next, the user enters parameters for Monte Carlo statistical analysis and clicks on Calculate Now button.
Step 3. See results: In a split second ToleranceCalc delivers the results in the Results pane as shown below.

Where L is the distance from datum to point-of interest, x and y are the co-ordinates of the point-of-interest. Clicking on any standard deviation values display the corresponding Monte Carlo statistical analysis results as shown below.
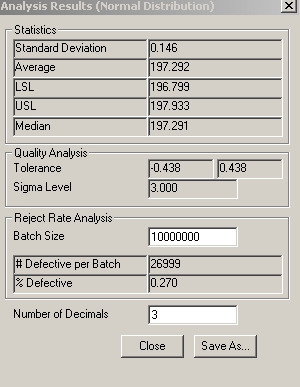
Here ToleranceCalc is suggesting a tolerance of plus/minus .438 be allocated to the Y co-ordinate of the point-of interest for the assembly to perform with 3 Sigma quality. The results can be saved in CSV file format that can be read by appropriate Microsoft Office applications.
ToleranceCalc includes a powerful feature that help users to determine which features are critical and not so critical early in the design process.
Clicking on the Sensitivity tag shows the Sensitivity pane as shown in the following figure.
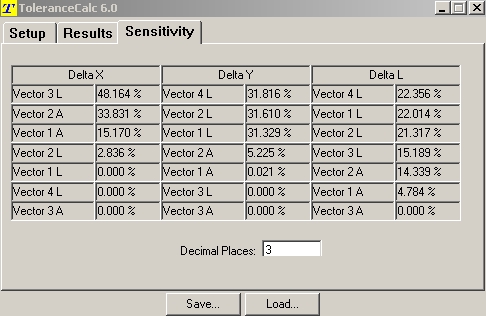
The sensitivity analysis report developed automatically for each analysis run delivers a sorted list that lets users know which tolerances have the greatest impact on the stack-up. Vital sensitivity analysis information from ToleranceCalc 6.0 enables users to develop informed tolerance allocation strategies – tighten tolerances on dimensions that are not important and loosen tolerances on dimensions that involve expensive manufacturing process.